|
|
|
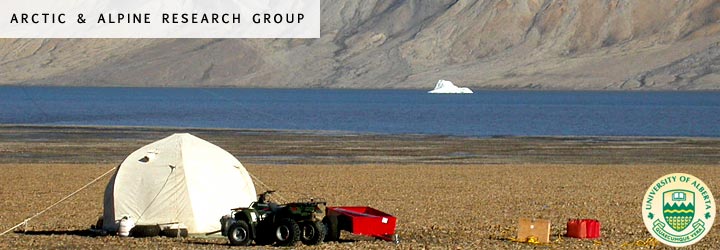
Devon Island Ice Cap The 14,000 km2 Devon Island ice cap is the site of most of our field activities at present. Our long-term goal is to understand the dynamics and ongoing changes in the ice cap, and their relationship to climate change. Dave Burgess and Doug Mair began work there in 2000 with a study that resulted in a reconstruction of the 1960-2000 mass balance of the whole ice cap. Surface melt was modeled using a degree approach with meteorological data from Resolute Bay corrected using measurements from weather stations on the ice cap Accumulation patterns were reconstructed from measurements of the water equivalent depth of the 1963 “bomb layer” in a network of shallow boreholes drilled across the accumulation zone of the ice cap. Subsequently, Jamie Davis and Liam Colgan have extended this borehole network, and Dave Burgess added a further 3 boreholes along the CryoSat transect on the south side of the ice cap. In 2007, Jamie Davis and Ben Gready will add more boreholes in the northeast of the ice cap and use high frequency ground penetrating radar to interpolate patterns of accumulation between boreholes. Dave Burgess made surface velocity measurements at higher elevations on the ice cap from 2000-2002 and used SAR interferometry to map the velocity field across the majority of the ice cap. The Interferometric measurements were calibrated using the ground measurements. Dave also used the SAR-derived velocity data to compute the iceberg calving flux from the ice cap. For this he also used ice thickness measurements from a detailed airborne radio echo sounding survey of the ice cap made by Julian Dowdeswell (SPRI, Cambridge, UK) in 2000. In recent years, we have added more velocity stakes along the CryoSat line, around the 1200m-elevation contour of the ice cap, and across the main north-south ice divide in the southeast region of the ice cap. Liam Colgan has computed the ice outflow from the region above 1200m and made detailed comparisons with the accumulation in this region to determine whether the higher regions of the ice cap are thickening (as suggested by airborne laser altimetry) or thinning. Liam also used detailed analyses of shallow ice cores to reconstruct the history of snow accumulation in this region to determine whether the proposed thickening from 1995-2000 is coincident with a period of anomalously high snow accumulation (it isn’t!). Jamie Davis is investigating thickness changes in the region on either side of the north-south ice divide. There is evidence for significant flow variability in the glaciers draining east from this divide, which may bring about variability in the location of the ice divide and the thickness of the ice there. Fast flow currently seems to be limited to the upper reaches of these glaciers, though ice surface features clearly indicate that it formerly extended all the way to the current ice margin. Thus it may be that a surge is in progress in this region. Jamie’s work involves velocity surveys, kinematic GPS surveys, photogrammetry, airborne laser altimetry, shallow ice coring, and “coffee-can” measurements of in situ ice thickness change. In 2007, we will initiate a major study of the dynamics of the Belcher Glacier, the largest outlet draining the ice cap and an important iceberg calving source. This study will be a contribution to the International Polar Year project Glaciodyn that is led by Hans Oerlemans (Utrecht) and Jon-Ove Hagen (Oslo). Our project will be a collaborative venture with Jeff Kavanaugh (Alberta), Gwenn Flowers (SFU), Shawn Marshall (Calgary), Sarah Boon (UNBC), Luke Copland (Ottawa), Dave Burgess and Lawrence Gray (Canada Centre for Remote Sensing), Lev Tarasov and Trevor Bell (Memorial) and hopefully Bernd Kulessa (Swansea) and Andy Smith (British Antarctic Survey. The overall goal is to develop and validate a high resolution coupled model of the hydrology and dynamics of the glacier (Gwenn Flowers and Shawn Marshall) that can be nested within a lower resolution model of the whole ice cap (Lev Tarasov). This model will be used to investigate the response of outlet glacier flow to changes in climate, sea level, and ocean temperatures and to study the roles of glacier hydrological changes and iceberg calving in determining how the glacier responds. The field program will involve detailed mapping of the ice thickness, subglacial topography and bed reflectance using GPR (Jeff Kavanaugh and Christine Dow), mapping of snow accumulation patterns in the catchment using ice cores and GPR (Jamie Davis, Ben Gready and Luke Copland), measuring and modeling surface melt and refreezing processes, and mapping and measuring the seasonal development of the supraglacial drainage system, surface water storage, and water inputs to the glacier (Sarah Boon, Martin Sharp, Faye Wyatt, Josh Padolsky, Angus Duncan ), monitoring the space-time evolution of the glacier’s surface velocity field using a wireless network of autonomous GPS sensors (Brad Danielson), investigating bed properties and the effects of water drainage into the glacier on basal motion using active and passive seismic methods (Bernd Kulessa and Andy Smith) and investigating iceberg calving rates and processes (Lev Tarasov). The field program will be supported by remote sensing studies of the ice velocity, the occurrence of surface melt, and surface drainage development. In September 2006, Trevor Bell’s group made use of the icebreaker RCGS Amundsen and its launch, the MV Heron, to map the seafloor topography in front of the glacier, obtain sub-bottom profiles of the sea floor sediments, and CTD profiles through the water column. We hope to extend the sea floor mapping and repeat these measurements at least once more during the IPY.
|
||